

Trust is the primary driver of sustainable brand growth because it converts relevance into repeat purchase, advocacy, and permission to stretch into new categories. According to Northwestern's IMC program, 87% of consumers are willing to pay more for products from brands they trust, 40% of U.S. consumers say they will never return after a trust breach, and 80% of millennials actively prefer brands they perceive as trustworthy. Those three numbers together describe a business model, not just a sentiment score.
Your immediate action: identify one trust signal you can make verifiable this week. Publish your ingredient provenance page, post a third-party certificate, or clarify your returns policy with a specific timeline. One concrete, checkable proof point does more for consumer confidence than a month of brand messaging.
The Edelman Trust Barometer Special Report frames it plainly: trust and relevance together create permission to grow. Without trust, relevance is just attention, and attention alone does not compound.
Table of Contents
- What brand trust actually is and why it drives long-term loyalty
- The operational drivers that actually create trust
- The research-backed link between trust and measurable growth
- A practical playbook for building and sustaining trust
- How to measure trust: metrics and a working dashboard
- Realistic timelines and where to invest your budget
- How to recover quickly after trust is damaged
- Three examples that show how trust decisions drive growth
- Key Takeaways
- Why most brands treat trust as a marketing problem when it is actually an operations problem
- Formlypro gives supplement brands the proof layer trust requires
- Useful sources for marketing leaders
What brand trust actually is and why it drives long-term loyalty
Brand trust is the belief that a brand can and will deliver value consistently and ethically. That definition contains two distinct components, and most marketing teams only manage one of them.
Competence/reliability covers whether the product does what it claims, whether delivery is consistent, and whether quality holds across SKUs and channels. Intent/integrity covers whether the brand is honest about its ingredients, sourcing, pricing, and motives, and whether it acts in the customer's interest when things go wrong.

A 2024 meta-analysis of 50 years of consumer trust research found that integrity-based antecedents have become stronger drivers of trust than reliability alone. Consumers increasingly assume baseline competence. What they are now evaluating is whether you mean it.
| Dimension | What it covers | How customers evaluate it |
|---|---|---|
| Competence / reliability | Product quality, delivery consistency, feature accuracy | Repeat experience, verified reviews, third-party testing |
| Intent / integrity | Transparency, ethical sourcing, honest pricing, data privacy | Ingredient disclosure, supply chain pages, privacy policy clarity |
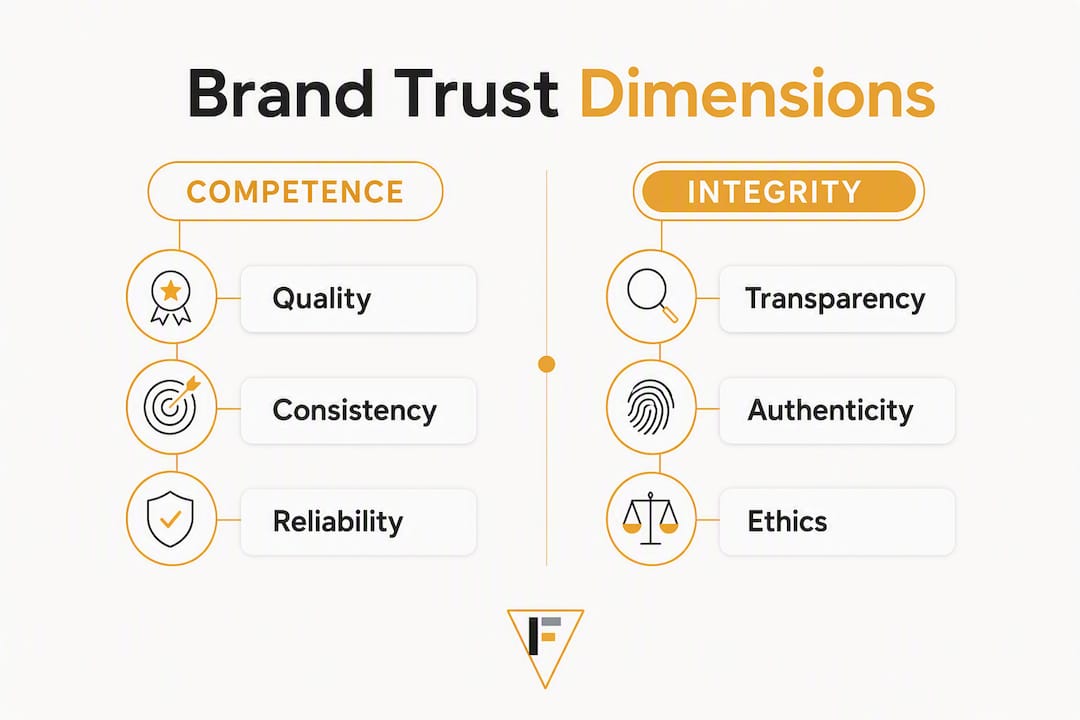
Both dimensions matter for premium pricing and long-term loyalty. A brand that delivers reliably but hides its sourcing will lose ground to a competitor that does both. The meta-analysis confirms this: the strength of both antecedents has grown, meaning customers are raising the bar on each simultaneously.
The operational drivers that actually create trust
Trust is not built through campaigns. It is built through repeated operational decisions that customers can verify. Here are the core drivers, with a practical note on each.
-
Product quality. Research shows that 46% of consumers cite product quality as the top loyalty driver. Rewards programs fail when the product foundation is weak. Quality is the floor, not a differentiator.
Pro Tip: Before launching any loyalty or referral program, audit your one-star reviews for product-quality complaints. If more than 15% of negative feedback is quality-related, fix the product before scaling the program.
-
Ingredient and sourcing transparency. Customers in supplement, food, and wellness categories now expect to see where ingredients come from. A provenance page with supplier names and certifications outperforms a generic "quality commitment" statement. Ingredient transparency is one of the fastest ways to differentiate in a crowded category.
Pro Tip: Link your certificate of analysis (COA) directly from the product page, not buried in a FAQ. The click path to proof matters.
-
Customer service and recovery. How a brand handles a failure matters more than the failure itself. A fast, honest response to a complaint builds more trust than a flawless product experience, because it demonstrates intent.
-
Data privacy and security. Especially for wellness and health brands, customers share sensitive information. A clear, plain-language privacy policy and explicit opt-in practices signal that you take that responsibility seriously.
-
Third-party validation. Expert endorsements, certifications, and verified review platforms carry more weight than owned content. Gartner's analysis of the AI-era trust environment confirms that credibility signals like advocacy and expert proof now determine discoverability and preference, not just conversion.
-
Consistent brand experience across touchpoints. Street Fight's analysis makes the point sharply: small inconsistencies in tone, packaging, or signature can erode trust quickly. Customers notice when your email voice does not match your packaging, or when your website claims differ from your label.
The research-backed link between trust and measurable growth
The evidence connecting trust to commercial outcomes is not correlational guesswork. It comes from multiple source types, each measuring a different part of the causal chain.
The Northwestern IMC figures on willingness to pay (87%), permanent churn after trust loss (40%), and millennial preference (80%) come from consumer behavior surveys measuring stated and revealed preference. The Edelman Trust Barometer adds a structural finding: earned voices, meaning unpaid peer validation and expert endorsement, matter more than paid or owned channels for driving purchase decisions. The 2024 meta-analysis synthesizes decades of academic work to show that both integrity and reliability antecedents have strengthened, meaning the commercial stakes of trust have risen, not stabilized.
What this means for your next 90 days: prioritize proof over promises. Audit every owned channel for claims that cannot be independently verified, and replace at least three of them with checkable proof points. A COA link, a supplier name, a response-time commitment with a published track record. That shift from assertion to evidence is where the commercial return on trust actually starts.
A practical playbook for building and sustaining trust
Trust-building has a sequence. Teams that skip to loyalty programs before fixing the product and proof layer waste budget and often accelerate churn by raising expectations they cannot meet.
Short-term wins (0–30 days)
- Publish a transparency page covering ingredients, sourcing, and manufacturing standards.
- Add verifiable third-party certificates to product pages with direct links to the issuing body.
- Clarify your returns and refund policy with specific timelines, not vague commitments.
- Audit brand voice consistency across email, packaging, and social. Fix the three biggest mismatches.
Mid-term programs (30–90 days)
- Implement a structured service recovery protocol (see Section 8 for the framework).
- Pursue at least one third-party certification relevant to your category (NSF, USP, or equivalent).
- Launch a verified review program through a recognized platform, not a self-hosted testimonial page.
- Review your compliance workflow for gaps that could surface as trust failures under regulatory scrutiny.
Long-term capabilities (90+ days)
- Build supply chain traceability documentation that can be shared with customers on request.
- Establish a community advocacy program that rewards unpaid peer validation, not just purchases.
- Govern AI-generated messaging with a human review step before publication to prevent credibility drift.
| Tactic | Impact | Effort | Priority |
|---|---|---|---|
| Transparency / provenance page | High | Low | Start this week |
| COA links on product pages | High | Low | Start this week |
| Returns policy clarity | Medium | Low | Start this week |
| Third-party certification | High | High | 60–90 day investment |
| Verified review platform | High | Medium | 30-day setup |
| Supply chain traceability | High | Very high | Long-term capability |
| Community advocacy program | High | High | After product quality is locked |
Pro Tip: Do not launch a loyalty rewards program until your NPS is above 40 and your one-star review rate is below 10%. Rewards amplify the existing experience. If that experience is shaky, rewards accelerate disappointment, not loyalty.
How to measure trust: metrics and a working dashboard
Trust is a leading indicator of growth, not a lagging one. By the time churn rises or CLV drops, the trust erosion happened months earlier. Gartner's framing is direct: brands that govern human experience as a formal system see measurable customer value gains versus peers that do not.
Outcome metrics (lagging):
- Repurchase rate by cohort
- Customer lifetime value (CLV) trend
- Churn rate and churn reason codes
- Net Promoter Score (NPS) trend over 6-month rolling windows
Leading indicators (act on these before outcomes shift):
- Verified review volume and average rating velocity
- Unpaid advocacy mentions (social listening, community forums)
- Expert endorsement count and reach
- Response time to flagged customer issues
- Sentiment shift in post-purchase surveys
A compact 4-metric trust dashboard:
- Trust signals: verified review count, endorsement mentions, COA page visits
- Behavioral signals: repurchase rate, referral rate, cart abandonment on trust-sensitive pages
- Financial outcomes: CLV by trust-signal cohort, revenue from returning customers
- Remediation speed: average time from issue flagged to resolution confirmed
For attribution modeling, a straightforward approach: segment customers by whether they engaged with a trust signal (viewed a COA, read a provenance page, clicked a certification badge) before purchase. Compare 90-day repurchase rates between that segment and the control group. The delta is your trust-signal lift, and it gives you a number to take to a CFO.
Realistic timelines and where to invest your budget
Trust-building is not a campaign. It is a capability investment with a compounding return. Here is a realistic view of what happens when.
| Horizon | Activities | Typical investment area |
|---|---|---|
| 0–30 days | Transparency pages, policy clarity, COA links | Content and design (low cost) |
| 30–90 days | Third-party certifications, CX overhaul, verified reviews | Certification fees, CX tooling |
| 90 days | Supply chain documentation, community programs | Operations, community management |
| 90+ days | Product quality investments, full traceability | R&D, supply chain infrastructure |
For budget allocation across a trust program, a reasonable starting split is roughly 40% on experience quality (product and service), 25% on verification and certification, 20% on community and advocacy, and 15% on compliance and governance. Those proportions shift as the program matures, with verification costs dropping once certifications are in place and community costs rising as the program scales.
Pro Tip: Spend on product quality and service recovery before you spend on packaging or brand storytelling. A beautifully packaged product that underdelivers destroys trust faster than plain packaging that overdelivers. The research on product quality as the primary loyalty driver is unambiguous on this point.
How to recover quickly after trust is damaged
The 40% permanent churn figure from the Northwestern research is the number that should keep brand managers up at night. But it also implies that 60% of customers who experience a trust breach are recoverable, if the response is fast and credible.
The six-step recovery framework:
- Acknowledge within 24 hours. A public or direct acknowledgment that the issue is real and being taken seriously. No deflection, no legal hedging.
- Investigate and share a timeline. Tell the customer when they will hear back with a root-cause finding.
- Remediate with a concrete offer: a refund, a verified replacement, or a transparent root-cause report. The offer should match the severity of the breach.
- Communicate the fix. Explain what changed operationally so the failure cannot recur. Customers want to know the system is fixed, not just their individual case.
- Follow up within 48 hours. Only 48% of organizations consistently follow up with flagged customers within 48 hours. Closing that gap is one of the fastest ways to convert a detractor into a neutral or even a promoter.
- Measure closure. Track NPS change, repeat purchase rate, and sentiment shift for the affected cohort over 90 days.
Recovery measurement checklist:
- NPS change for affected cohort at 30 and 90 days post-resolution
- Repurchase rate versus pre-incident baseline
- Sentiment shift in post-resolution surveys
- Average time from issue flagged to resolution confirmed
- Escalation rate (how many cases required a second contact)
Three examples that show how trust decisions drive growth
Supplement brand adds COA links to product pages. A mid-size supplement brand added certificate of analysis links directly to each product page, sourced from an independent third-party lab. Within one quarter, their verified review volume increased and repeat purchase rates in the cohort that clicked the COA link outpaced the control group. The lesson: proof that is one click away converts skeptics. Proof buried in a PDF download does not.
Healthcare brand uses storytelling to build category authority. A wellness brand facing a crowded market shifted from feature claims to narrative-driven trust building, publishing founder sourcing stories and supplier profiles. Earned media mentions increased and paid acquisition costs dropped as organic search traffic from trust-related queries grew. The lesson: stories that contain verifiable facts outperform stories that contain only values.
B2B supplement platform uses strategic friction to signal credibility. Rather than offering instant access, a B2B formulation platform added a brief onboarding vetting step before granting full platform access. Conversion rates from trial to paid subscription rose because the friction signaled seriousness and filtered for committed buyers. The lesson: in high-stakes categories, making customers work slightly harder to access your product can increase perceived credibility, not reduce it.
Key Takeaways
Trust converts relevance into repeat purchase, advocacy, and pricing power, and it must be measured as a leading indicator before churn and CLV shifts make the damage visible.
| Point | Details |
|---|---|
| Trust has two components | Manage both competence/reliability and intent/integrity; integrity is now the stronger driver. |
| Product quality is the floor | 46% of consumers cite product quality as the top loyalty driver; fix it before scaling rewards. |
| Proof beats promises | Replace unverifiable claims with COA links, certifications, and provenance pages this week. |
| Measure trust as a leading indicator | Track verified review velocity, advocacy mentions, and response time before churn rises. |
| Formlypro supports the full trust stack | Formlypro's compliance workflow, ingredient intelligence, and packaging tools embed verifiable proof directly into the product development process. |
Why most brands treat trust as a marketing problem when it is actually an operations problem
The conventional framing puts trust in the brand team's lane: messaging, tone, storytelling, campaign consistency. That framing is not wrong, but it is incomplete in a way that costs brands real money.
The 40% permanent churn figure is not caused by a bad ad. It is caused by a product that underdelivered, a service team that did not follow up, or a label claim that turned out to be unverifiable. Those are operations failures, not communications failures. Fixing them requires product managers, supply chain leads, and compliance teams in the room, not just brand strategists.
The brands that compound trust fastest are the ones that have made it a cross-functional KPI. They track COA page visits alongside NPS. They measure response time to flagged issues the same way they measure campaign CTR. They treat a supply chain transparency page as a growth asset, not a compliance checkbox.
The challenge for you: pick one trust metric that currently lives in no one's dashboard and put it in yours this month. Not a sentiment score. Something operational: follow-up rate within 48 hours, COA link click rate, or certification renewal status. Make it someone's job to move that number. That is where the compounding starts.
Formlypro gives supplement brands the proof layer trust requires
Building trust in the supplement and wellness category is harder than in most. Customers cannot see inside a capsule. Regulators have specific requirements. And competitors make claims that range from well-supported to completely unverifiable. The brands that win long-term are the ones that make their proof checkable at every step.
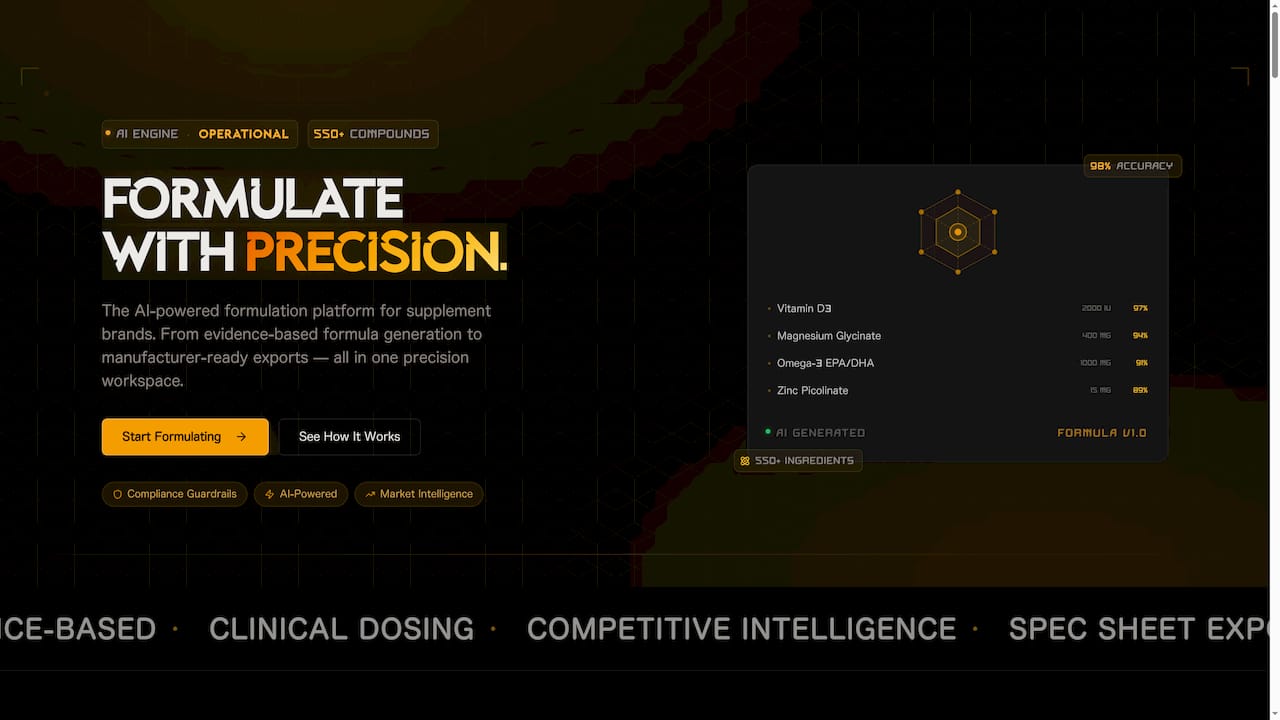
Formlypro is built for exactly that. The platform's ingredient intelligence and research-backed formulation tools give you the substance behind your claims. The built-in compliance workflow, covering FDA and DSHEA requirements, means your product pages and labels reflect what your formula actually contains. The 8-phase product development pipeline takes a new product from concept through formulation, prototyping, compliance, and production with documentation at every stage, so your COA, your provenance page, and your packaging all tell the same verifiable story. The AI mockup designer means your packaging communicates that story consistently across every SKU.
If you are ready to build a product that earns trust before the first review comes in, start with Formlypro and see how the platform maps to your next launch.
Useful sources for marketing leaders
These are the primary reports and studies referenced in this article. Each is worth reading in full for the original methodology and data.
-
What Is Brand Trust and Why It's Your Most Valuable Asset — Northwestern IMC Professional. Report. Source of the 87% willingness-to-pay, 40% permanent churn, and 80% millennial preference figures. Essential reading for anyone making the business case for trust investment.
-
In the AI Era, Trust Scarcity Is Rewriting the Rules of Brand Growth — Gartner. Research note. Explains how AI-driven content abundance creates trust scarcity and why credibility signals now influence discoverability, not just conversion.
-
How to Build Customer Loyalty — SoGolytics. Article. Source of the 48% follow-up-within-48-hours finding and practical guidance on closing the operational execution gap.
Note: Trust research evolves quickly, and specific figures may be updated as new data is published. Always check the original source for the most current methodology and sample details before citing in stakeholder presentations.