
Analytics should be the compass for every strategic choice your startup makes: pick one North Star Metric, instrument the funnel that feeds it, and run a weekly decision ritual around the numbers.
Three actions to take this week:
- Pick your North Star Metric. One number that best captures the value your product delivers to customers. Weekly active users, activated accounts, or revenue per cohort — choose one and defend it.
- Instrument your core funnel. Set up event tracking on the five to seven steps between acquisition and your product's value moment. If you can't measure it, you can't improve it.
- Start a weekly data ritual. Block 30 minutes every Monday to review your North Star and two or three supporting metrics. Decisions made in that meeting get logged with the data that drove them.
You'll know analytics is working when experiments get validated in days instead of months, your unit economics are predictable, and you can walk into an investor meeting with a clean metrics story.
Pro Tip: Don't wait until your data is "clean enough" to start. A rough North Star tracked consistently beats a perfect dashboard nobody opens.
Key Takeaways
Analytics works for startups when it drives decisions, not just reports. Pick one North Star, instrument it, and run weekly rituals around it.
| Point | Details |
|---|---|
| Start with one North Star | One metric that captures your product's core value, tracked weekly, beats 20 metrics tracked never. |
| Stage gates your stack | Use GA4 and Mixpanel pre-PMF; add Fivetran, Snowflake, and dbt post-PMF when signal justifies the cost. |
| Analytics carries real risk | ZEW research shows BDA adoption raises operating costs and can reduce survival probability; adopt deliberately. |
| Own metrics by role | Assign each metric to a single accountable owner; shared ownership means no ownership. |
| Embed analytics in product | In-product dashboards and health scores are among the strongest B2B retention levers available. |
Table of Contents
- Why does analytics matter for your startup's strategy?
- What should you measure at each startup stage?
- Which metrics actually matter and which ones mislead you?
- How do you turn analytics into actual strategic decisions?
- How should you build your analytics stack?
- Who should own analytics and how should decisions get made?
- What are the most common analytics mistakes founders make?
- How can analytics become a product feature, not just an internal tool?
- What most founders get wrong about analytics
- Sources
Why does analytics matter for your startup's strategy?
Analytics gives startups four things that gut instinct alone cannot: decision support grounded in evidence, forecasting that replaces guesswork with leading indicators, a signal investors trust, and a feedback loop that makes products better faster. MIT Sloan's research frames analytics as the "secret sauce" of startup success, specifically because it functions as a source of truth for growth projections, staffing decisions, and product scaling when treated as a top-level strategic function rather than a reporting afterthought.
The outcomes founders should expect from analytics aren't abstract:
- Better resource allocation. Data on which acquisition channels convert and which features drive retention lets you cut spend on what doesn't work before it drains the runway.
- Faster product iteration. When you can measure activation rates and session depth, you stop debating what to build and start testing it.
- Investor credibility. Founders who walk in with clean cohort retention charts and a clear LTV:CAC story close rounds faster than those who rely on top-line growth alone.
- Scalable headcount planning. Analytics lets you grow revenue without growing the team proportionally, because you know exactly which levers to pull.
The risk side is real, though. A ZEW working paper found that adopting big-data analytics raises operating costs and can reduce survival probability for early-stage companies. The same study found that startups which survive the transition tend to achieve higher sales, stronger employee growth, and better access to venture capital. The implication: analytics is a performance amplifier, not a safety net. Adopt it deliberately, not because it sounds sophisticated.
The MDPI study on business analytics in startups adds a useful nuance: the relationship between analytic capabilities and growth performance is mediated by entrepreneurial opportunity exploitation. In plain terms, analytics doesn't create growth by itself. It amplifies your ability to spot and act on opportunities. That's the frame to keep in mind throughout this playbook.
What should you measure at each startup stage?
Different stages demand different priorities. Pre-PMF, you're trying to find signal. Post-PMF, you're trying to amplify it. At growth stage, you're trying to scale it without breaking it.
Pre-PMF: find signal, not scale
Your single objective is to validate that a real problem exists and that your solution solves it for a repeatable customer type. Analytics here is mostly qualitative-plus-quantitative: combine user interviews with lightweight event tracking.
- Track activation rate (the percentage of new users who reach your product's core value moment).
- Measure retention at day 1, day 7, and day 30.
- Log qualitative feedback alongside quantitative session data.
- Use a simple spreadsheet or a lightweight tool like GA4 or Mixpanel to capture funnel events.
- Avoid building a data warehouse. A Google Sheet updated weekly is enough.
Most decisions at this stage need qualitative insight. Definite's stage-by-stage framework notes that assembling a full stack too early creates a maintenance burden that pulls engineering time away from the product itself.
Post-PMF / Series A: amplify the signal
You've found repeatable retention. Now the job is to understand why it works and how to acquire more of the right customers efficiently. AWS guidance positions this stage as the moment to use analytics for rapid experimentation and business-model refinement.
- North Star shifts from activation to a revenue or engagement metric (MRR, weekly active users, or similar).
- Add CAC by channel, LTV by cohort, and churn rate by segment.
- Connect a product analytics tool (Amplitude or Mixpanel) to a lightweight warehouse (Snowflake or a managed cloud option).
- Run your first structured A/B tests with defined hypotheses and sample sizes.
Growth / expansion: scale without breaking
The focus moves to efficiency, forecasting, and building analytics into the product itself.
- LTV:CAC ratio and payback period become board-level metrics.
- Introduce dbt for data transformation and Fivetran for reliable pipeline ingestion.
- Add ML-driven forecasting (AWS Forecast or SageMaker) for demand and churn prediction.
- Build internal dashboards that give every team lead visibility into their metrics without requiring a data analyst to run queries.
| Stage | Top Metrics | Why They Matter | Owner |
|---|---|---|---|
| Pre-PMF | Activation rate, D1/D7/D30 retention | Validates product-market signal | Founder / PM |
| Post-PMF | MRR, CAC by channel, LTV, churn | Proves unit economics and scalability | Founder / Growth lead |
| Growth | LTV:CAC, payback period, NPS, ARPU | Guides capital allocation and expansion | CFO / Data analyst |
Which metrics actually matter and which ones mislead you?
The minimum measurement set for any startup is a North Star Metric plus five supporting metrics. Everything else is optional until you have the bandwidth to act on it.
Essential metrics:
- North Star Metric. The single number that best represents the value your product delivers. For a SaaS product, this is often weekly active users or activated accounts. For a marketplace, it might be transactions per week.
- Customer Acquisition Cost (CAC). Total sales and marketing spend divided by new customers acquired in the same period. Track it by channel.
- Lifetime Value (LTV). The total revenue you expect from a customer over their relationship with you. Even a rough estimate is better than none.
- LTV:CAC ratio. The ratio that tells you whether your growth is economically sustainable. A ratio below 3:1 usually signals a problem in either retention or acquisition efficiency.
- Churn and retention cohorts. Monthly churn rate and cohort retention curves. These tell you whether your product keeps its promise over time.
- Activation rate. The percentage of new users who reach the value moment within a defined window (usually 7 days). Low activation is almost always the first problem to fix.
- Monthly Recurring Revenue (MRR). For subscription businesses, MRR is the cleanest measure of business health. Track new MRR, expansion MRR, and churned MRR separately.
- Conversion rates. At each funnel stage: visitor to trial, trial to paid, free to upgrade. A drop at any stage points to a specific fix.
- Product engagement signals. Feature adoption rates, session frequency, and depth of use. These predict churn before it shows up in revenue numbers.
Vanity metrics to stop tracking:
- Raw pageviews (tell you nothing about whether visitors found value)
- Total app installs (acquisition without activation is noise)
- Social media likes and follower counts (unless your business model is media)
- Registered users (activated users is the number that matters)
Pro Tip: Define your activation event precisely. "User activated" should mean the user experienced the core value of your product, not just that they signed up. Map your product's value moment first, then instrument the event that marks it. Combining this with qualitative research, as Growthegy recommends, gives you the "why" behind the number.
For supplement and wellness founders, product analytics for smarter decisions explains how to connect ingredient-level data to customer retention signals, which is a useful extension of this framework.
How do you turn analytics into actual strategic decisions?
Analytics must lower the time between a question and a decision. The goal is not more dashboards. It's faster, better-validated bets.
The decision loop looks like this:
- State the hypothesis. "We believe that adding an onboarding checklist will increase activation rate by 15% within 7 days."
- Pick the metric. Activation rate within 7 days of signup.
- Instrument the event. Make sure the activation event fires correctly in Amplitude or Mixpanel before you launch the test.
- Run the experiment. Define the sample size needed for statistical validity before you start. Don't peek at results early.
- Analyze the outcome. Did the metric move? Was the sample large enough to trust the result?
- Assign an action. Ship it, kill it, or iterate. Log the decision and the data that drove it.
For forecasting, leading indicators matter more than lagging ones. If you want to forecast next quarter's MRR, track trial-to-paid conversion rate and time-to-activation today. Both move before revenue does.
A simple forecast template for a SaaS startup:
For retention root-cause analysis, cohort segmentation is the fastest path to an answer. Split your churned cohort by acquisition channel, onboarding path, and plan type. The segment with the highest churn usually points to a specific acquisition or activation problem, not a product-wide failure.
Startupik's practical guide makes a point worth repeating: a simple scorecard and a weekly review ritual outperforms a sophisticated BI setup that nobody opens. Sophistication you don't use is just overhead.
How should you build your analytics stack?
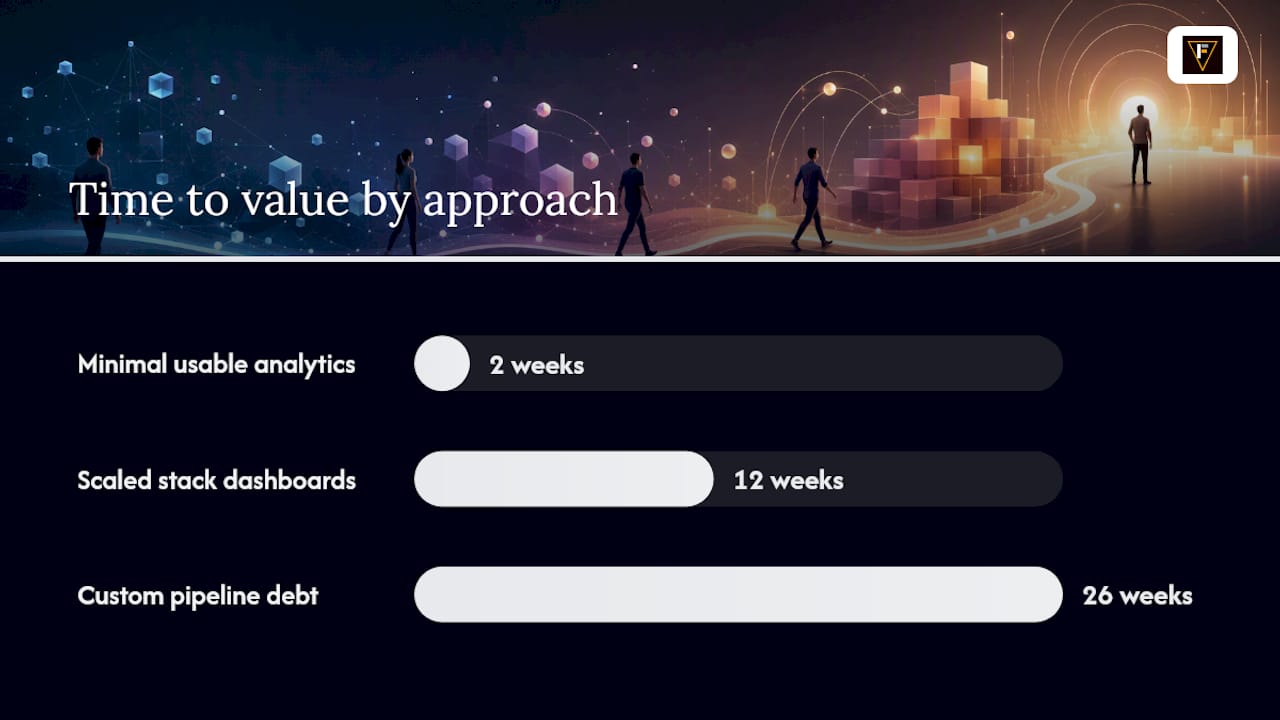
The core decision is simple: adopt a light integrated stack early, or keep instrumentation minimal until you have PMF. BVP Atlas advises against building custom data infrastructure early. Pre-built tools reduce data debt and get you to answers faster. Custom pipelines built before you know what questions you're asking become expensive technical debt within six months.
Integrated platform vs. assembled stack:
Integrated platforms (a single tool that handles ingestion, transformation, and visualization) give you speed and a governed semantic layer. The tradeoff is limited customization and vendor lock-in. Assembled stacks (Fivetran for ingestion, dbt for transformation, Snowflake for storage, Amplitude or Mixpanel for product analytics, Power BI or Looker for visualization) give you flexibility and data ownership, but require a dedicated data engineer within six months and carry higher maintenance overhead.
| Dimension | Integrated Platform | Assembled Stack |
|---|---|---|
| Best for | Pre-PMF to early Series A | Series A and beyond |
| Cost shape | Flat monthly fee, predictable | Scales with data volume and tooling |
| Engineering required | Minimal (days to set up) | Moderate to high (weeks to months) |
| Data ownership | Vendor-managed | Full ownership, self-hosted or cloud |
| Scale / latency | Near real-time for most use cases | Real-time possible with engineering |
| Primary use case | Product analytics, marketing, BI | BI, ML, data science, multi-source |
Concrete tool recommendations by stage:
Pre-PMF:
- GA4 for web traffic and basic funnel tracking (free, fast to set up)
- Mixpanel or Amplitude for product event tracking (both have free tiers)
- Google Sheets for cohort analysis and metric tracking
Post-PMF / Series A:
- Amplitude or Mixpanel for product analytics
- Fivetran for reliable data pipeline ingestion
- Snowflake as a managed cloud warehouse
- dbt for data transformation and metric governance
Growth stage:
- AWS SageMaker for custom ML models (churn prediction, LTV scoring)
- AWS Forecast for time-series demand forecasting
- AWS Personalize for recommendation features inside the product
- Power BI or Azure ML for managed visualization and model deployment where the team prefers Microsoft's ecosystem
Realistic cost and timeline:
Minimal usable analytics (days to a few weeks, $0–$2,000/month): GA4 plus Mixpanel or Amplitude free tier, a spreadsheet for cohort tracking, and a weekly review ritual. No engineering hire needed.
Scaled stack (two to four months, $2,000–$7,000+/month plus a data analyst or engineer): Fivetran, Snowflake, dbt, and a product analytics tool. Expect two to four months to reach a state where every team lead has a reliable dashboard.
Who should own analytics and how should decisions get made?
Analytics must be owned by a role accountable for business outcomes, not by engineering or a reporting function that produces charts nobody acts on.
A practical ownership map:
- Founder / CEO: owns the North Star Metric and the weekly decision ritual. Accountable for ensuring analytics informs strategy, not just reporting.
- Head of Product / PM: owns activation rate, feature adoption, and product engagement metrics. Responsible for instrumenting product events and running experiments.
- Growth lead / marketer: owns CAC by channel, conversion rates, and MRR growth. Runs acquisition experiments and owns attribution.
- Data engineer / analyst: owns pipeline reliability, metric definitions, and the semantic layer. Accountable for data quality, not for making decisions.
Weekly and monthly cadence:
Weekly: review North Star, activation rate, MRR, and churn. Assign an owner to investigate before the next meeting.
Monthly: review LTV:CAC, cohort retention curves, CAC by channel, and experiment results. Update the forecast model. Decide which experiments to run next month.
Experiment governance checklist:
- Write the hypothesis in one sentence before touching the product.
- Define the primary metric and the guardrail metrics (metrics you can't let drop).
- Calculate the minimum sample size before you launch.
- Assign a single owner who is accountable for the result.
- Define rollback conditions: if guardrail metric X drops by Y%, the experiment stops.
- Log the result and the decision in a shared experiment log, regardless of outcome.
Governance rules to prevent metric drift:
- Define every metric in a shared glossary before it appears in a dashboard.
- Use a semantic layer (dbt metrics, or a similar tool) so the same metric name always returns the same calculation.
- Never let two teams use different definitions of "active user" or "conversion." Inconsistency here is how startups end up with three different revenue numbers in the same board deck.
Pro Tip: Require every roadmap ticket to include a proposed metric impact. "This feature will increase activation rate by X% because Y." It forces the team to think in hypotheses, not features, and makes post-launch analysis automatic.
What are the most common analytics mistakes founders make?
The biggest threat to analytics isn't a bad tool. It's bad instrumentation and ambiguous metric definitions. You can have Snowflake and dbt and still make decisions on garbage data if the events feeding the pipeline are mislabeled or inconsistently fired.
Common pitfalls:
- Tracking vanity metrics. Pageviews, raw installs, and follower counts feel like progress. They rarely predict revenue or retention. Replace them with activation rate and cohort retention from day one.
- Inconsistent user IDs. If your anonymous pre-signup ID doesn't stitch to your authenticated post-signup ID, your funnel analysis is broken. Fix identity resolution before anything else.
- Misaligned event naming. "button_click" tells you nothing. "onboarding_checklist_completed" tells you everything. Establish a naming convention before you instrument a single event.
- Bad attribution. Last-click attribution overstates the value of bottom-of-funnel channels and understates the value of content and brand. Use multi-touch attribution or at minimum track first-touch and last-touch separately.
- Small-sample over-interpretation. Calling a winner after 50 conversions is how you ship features that hurt retention. Run experiments to statistical significance, or acknowledge the result is directional only.
- Ignoring qualitative signals. Numbers tell you what is happening. Customer interviews tell you why. Combining both, as market research methods for entrepreneurs explains, produces the highest-quality strategic insight.
The ZEW research is a useful reminder here: big-data analytics adoption raises operating costs and can reduce survival probability when adopted without the complementary capabilities to use it well. More data infrastructure is not always better. Better-defined metrics on a smaller stack almost always outperform a sprawling setup nobody trusts.
Simple data-quality tests to run weekly:
- Check that event counts for your top five events are within a normal range (a sudden drop usually means a broken SDK or a deployment that broke tracking).
- Verify that user ID stitching is working by spot-checking a sample of sessions that cross the signup boundary.
- Confirm that your North Star Metric calculation matches across your product analytics tool and your warehouse.
**On speed vs. accuracy, that's fine. Acknowledge the limitation, treat the result as directional, and move on. The cost of waiting for perfect data is usually higher than the cost of a wrong decision you can reverse.
How can analytics become a product feature, not just an internal tool?
Analytics can be the product or a value-added layer that improves retention and monetization. For B2B startups especially, giving customers visibility into their own data is often the stickiest feature you can build.
Use cases worth building:
- In-product dashboards for B2B customers. If your customers are businesses, showing them their own usage data, outcomes, or ROI inside your product increases perceived value and reduces churn. This is one of the strongest retention levers available to B2B SaaS companies.
- Recommendation features. AWS Personalize lets you build personalized recommendation engines without training a custom model from scratch. For e-commerce, content, or marketplace startups, this can drive meaningful lift in engagement and revenue.
- Health scores and automated alerts. Build a customer health score from product engagement signals and trigger automated outreach when a score drops. This is a practical application of SageMaker or Azure ML for startups that have enough customer data to train a simple model.
- Automated reporting. Give customers a weekly or monthly digest of their key metrics inside your product. It keeps them engaged and reduces support load.
Implementation requirements:
- Plan your data model for multi-tenancy from the start. Customer-facing analytics requires strict data isolation.
- Decide on latency early. Real-time dashboards require streaming infrastructure (Kinesis, Kafka, or similar). Batch updates (hourly or daily) are far cheaper and sufficient for most use cases.
- Build a semantic layer so that the metrics customers see match the metrics your team uses internally. Inconsistency here destroys trust fast.
- Minimum instrumentation: reliable event tracking, a warehouse, and a transformation layer (dbt) before you expose any data to customers.
Privacy and compliance for U.S. startups:
- Collect only the data you need to deliver the product's value. Data minimization reduces compliance risk and infrastructure cost.
- Use opt-in consent for behavioral tracking, especially if you serve consumers in California (CCPA) or other states with active privacy laws.
- Set sensible data retention policies. Storing five years of raw event data you'll never analyze is a liability, not an asset.
- For supplement and wellness brands, clinical data and compliance considerations add another layer: analytics that touches health claims must be handled with particular care around FDA and FTC guidelines.
For startups selling into clinical or healthcare channels, revenue cycle analytics provides a useful benchmark for the kinds of KPIs and reporting patterns that clinical customers expect from their vendors.
What most founders get wrong about analytics
The most common mistake isn't choosing the wrong tool. It's treating analytics as a reporting function instead of a decision function.
I've seen founders build beautiful dashboards that nobody opens because the metrics on them don't connect to any decision the team is actually making. The dashboard becomes a vanity artifact. The real decisions get made in Slack threads based on whoever spoke loudest in the last meeting.
The fix is almost embarrassingly simple: one metric per meeting, and every agenda item must reference a number.
Two things that work in practice:
- Require a proposed metric impact in every roadmap ticket. Not a guarantee, a hypothesis. "We expect this to move activation rate by X% because Y." It takes two minutes to write and makes post-launch analysis automatic.
- Keep the scorecard to five metrics maximum. Every metric you add dilutes attention. A team tracking 20 metrics is tracking zero metrics. Pick five, own them, and add a sixth only when you've retired one.
One counterintuitive lesson: the startups that get the most value from analytics are usually the ones that instrument the least. They pick one funnel, track it obsessively, and make decisions on it weekly. The ones that instrument everything and build elaborate data pipelines before PMF almost always end up with a maintenance burden that slows them down at exactly the moment they need to move fast.
Formlypro's approach to data-driven formulations reflects this: focused analytics on the metrics that actually predict product-market fit in the supplement vertical, not a sprawling data operation.
Sources
The sources below are the primary references used in this article. Each one is worth reading directly.
- Why analytics is the ‘secret sauce’ of startup success | MIT Sloan
- How startup companies scale with data analytics
- With Big Data: Adoption of big-data analytics and startup performance (ZEW DP 23-061)
- The Role of Business Analytics in Startups: Building a Data-Driven Foundation (MDPI)
If you're building in the supplement or wellness space and want analytics baked into your product development workflow from day one, Formlypro combines market research, competitive analytics, compliance guidance, and an 8-phase product development system in a single platform.