
TL;DR:
- Using product analytics reveals that more users do not necessarily lead to a healthier product economy.
- Tracking user behavior within the product enhances decision-making, retention, and long-term engagement, outperforming vanity metrics.
More users does not mean a healthier product. That assumption has burned more product budgets than any technical failure. If you want to understand why use product analytics, the answer starts here: acquisition without retention is just a leaky bucket with better marketing. Product analytics tells you what users actually do inside your product, where they drop off, which features drive value, and what predicts long-term engagement. For business analysts and decision-makers, it shifts strategy from gut feel to evidence. This article breaks down the mechanics, ROI, and practical applications you need to make that shift real.
Table of Contents
- Key Takeaways
- Why use product analytics and what makes it different
- Business impact: the ROI case for product analytics
- Pitfalls that kill analytics programs before they deliver
- How analytics accelerates product development feedback loops
- Practical applications for analysts and decision-makers
- My take on making product analytics actually work
- Take your product decisions further with Formlypro
- FAQ
Key Takeaways
| Point | Details |
|---|---|
| Activation predicts retention | Users who hit value early retain at 4x the rate of median products, making activation your top priority metric. |
| ROI is measurable | Better decision quality from product analytics can deliver an estimated 667% ROI by reducing wasted engineering spend. |
| Vanity metrics undermine strategy | Tracking the wrong data leads to analysis paralysis. Anchor every metric to a specific business decision. |
| Data velocity matters | Teams with real-time access to behavioral data make roadmap decisions before meetings, not weeks later. |
| Analytics shapes every phase | From go-to-market to retention, the role of analytics in product development spans the entire product lifecycle. |
Why use product analytics and what makes it different
Product analytics is the practice of tracking, measuring, and interpreting how individual users interact with your product at the event level. That means every button click, every feature triggered, every session started and abandoned. It is not the same as web analytics, which focuses on traffic sources and page behavior. It is not business intelligence, which aggregates revenue and operational data after the fact. Product analytics sits at the layer that answers the questions web analytics and BI cannot: what are users doing inside the product, and why are some of them staying while others leave?
The distinction matters because the decisions are different. Web analytics tells you how many people landed on your pricing page. Product analytics tells you which users clicked the upgrade button, then hesitated, then churned within 30 days. BI tells you revenue declined. Product analytics tells you which feature deprecation triggered the drop.
| Tool | What it measures | Core question answered |
|---|---|---|
| Web analytics | Traffic, sessions, page views | Where do users come from? |
| Business intelligence | Revenue, ops data, aggregated trends | How is the business performing? |
| Product analytics | In-product user behavior at event level | What are users doing inside the product? |
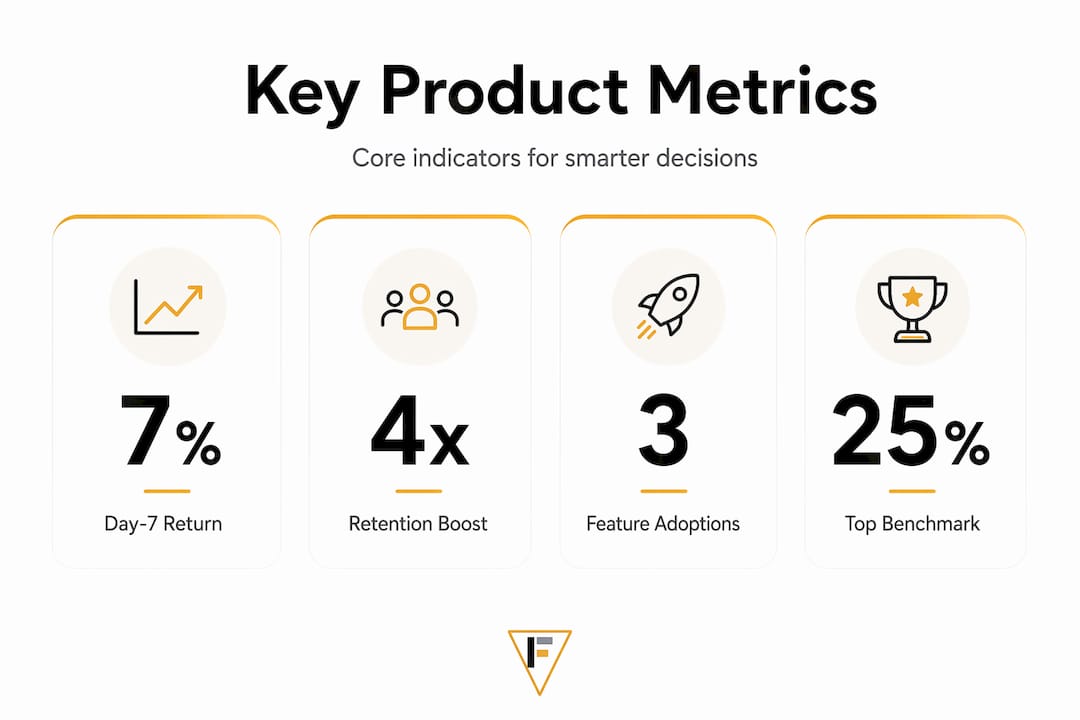
Core metrics in product analytics include activation rate, day-one and day-seven return rates, feature adoption, retention by cohort, and churn triggers. The gap between top and median products on just the day-one return rate is stark: 21% versus 5%. That single metric gap predicts whether your entire user engagement trajectory curves up or flatlines within weeks.
Business impact: the ROI case for product analytics
Here is a number that should end the "do we really need this?" conversation in your next planning meeting. Structured product analytics implementation yields an estimated 667% ROI, driven primarily by improving the quality of product decisions and cutting wasted engineering hours. A team making 20 product decisions per quarter, where each wrong call costs $25,000, saves $125,000 quarterly from a 25% improvement in decision accuracy. That is not a theoretical projection. That is arithmetic.

The retention data is equally direct. 69% of top seven-day activators are also top performers in three-month retention. Products that move users to activation fast do not just retain better in week one. They compound that advantage across the entire customer lifetime. Chasing acquisition without fixing activation is a strategy that costs more per retained user every single quarter.
The benefits of product analytics show up most clearly when teams stop asking "how many users do we have" and start asking "how many users got value in the first session":
- Reduced feature waste: When analytics shows that 70% of users never touch a feature you spent two months building, the next roadmap cycle looks very different.
- Smarter acquisition spend: Knowing which acquisition channels produce users who actually activate lets you reallocate marketing budget with precision.
- Faster troubleshooting: Behavioral event data surfaces friction points in hours, not sprint cycles.
- Retention lift from targeted intervention: Cohort analysis identifies the users most likely to churn before they do, enabling proactive outreach.
Pro Tip: Products that hit a 7% day-seven return rate rank in the top 25% for activation. Set this as an internal benchmark before you invest in any new feature development.
Pitfalls that kill analytics programs before they deliver
Most product analytics programs fail not because the tools are wrong, but because the implementation was never designed to answer specific questions. Teams instrument everything they can track, build dashboards no one owns, and then wonder why insights never reach roadmap decisions.
The most common trap is vanity metrics. Monthly active users, total downloads, page views. These numbers feel like progress, but measuring vanity metrics leads directly to analysis paralysis because they do not connect to any decision. When your dashboard shows MAU up 12%, that tells you nothing about whether your product is actually working. Retention rate by cohort, feature adoption depth, and activation rate tell you that.
Pre-implementation question mapping is the practice most teams skip and most regret skipping. Before you write a single tracking event, write down the five decisions you need analytics to inform. Then build your tracking plan backward from those decisions. This prevents the most expensive problem in analytics programs: collecting the wrong data for six months and then rebuilding the instrumentation from scratch.
Governance matters just as much. Dashboards without clear owners or defined decision use cases become unused decoration within two quarters. Every dashboard your team builds should have a named owner, a review cadence, and a documented list of decisions it informs.
Pro Tip: Before your next analytics review, ask each team member to name one decision they made differently last month because of product data. If nobody can answer that question, your analytics program is reporting, not deciding.
How analytics accelerates product development feedback loops
Shipping faster is not the same as learning faster. That distinction defines the importance of product analytics for teams trying to improve iteration quality. Real organizational challenge happens when data velocity lags behind feature shipping velocity. You can deploy three features in a sprint and have no behavioral signal on any of them for two weeks. By the time you know what broke, you have already shipped three more things on top of it.
The role of analytics in product development is to close that gap. When analysts have self-serve access to event-level data with real-time or near-real-time availability, the feedback loop shortens from weeks to hours. The practical impact on roadmap quality is significant:
- Experiment results arrive before the next planning meeting, so decisions are grounded in current behavior, not assumptions from the last quarter.
- Cohort analysis reveals whether new users behave differently from older ones, giving teams early signal on whether recent changes are attracting the wrong users or fixing the right problems.
- Funnel analysis pinpoints exactly where onboarding breaks, which removes the guesswork from prioritizing fixes.
- Feature flags paired with analytics let product teams run controlled rollouts and measure behavioral change before full release.
"Teams with instant data access make decisions before meetings instead of waiting days. That shift alone improves product quality in ways that sprint velocity metrics never capture."
Data fluency enables faster bets and stronger stakeholder trust because decisions arrive with evidence attached. VPs of Product who can query behavioral data without waiting for an analyst to write a report operate in a fundamentally different decision environment than those who cannot.
Practical applications for analysts and decision-makers
Understanding the theory of product analytics is useful. Knowing exactly where to apply it is where strategy gets built. Here is how product analytics maps directly to the decisions business analysts and decision-makers face most often:
Onboarding and activation optimization is where most ROI lives. Analyze the event sequences of your highest-retained users, find the behaviors that predict long-term engagement, and rebuild your onboarding to drive those behaviors in session one. This is the formulation analytics approach applied to product experience: identify what works in your top users and replicate the conditions.
The role of analytics in brand strategy and go-to-market planning gets sharper when you segment users by behavioral cohorts rather than demographics. A user who activates three core features in week one is a different customer than one who logs in twice and never returns. Both look the same in your CRM. Product analytics separates them so your marketing team can target the right message to the right segment.
Practical applications that belong in your next planning cycle:
- Use retention curves by acquisition channel to identify which channels produce users who actually stay.
- Build behavioral segments for upsell campaigns based on feature adoption depth, not account age.
- Map friction points in your onboarding funnel to specific events where drop-off spikes, then assign engineering resources accordingly.
- Connect in-product feedback triggers to behavioral signals, so users who show churn behavior receive intervention before they leave.
- Align your analytics review cadence with your sprint cycle so behavioral data informs every planning conversation, not just quarterly reviews.
The role of analytics in marketing becomes specifically powerful when you use product behavior data to define your best customers and then find more of them through acquisition. The industry trends in product development consistently point to behavioral segmentation as the factor that separates growing brands from stalling ones.
My take on making product analytics actually work
I've watched analytics programs at well-funded teams fail for the same reason every time. The organization treats analytics as a reporting function instead of a decision system. Reports get produced. Dashboards get built. Nobody changes what they build or how they market based on the data. That is not product analytics. That is expensive documentation.
What I've learned from working through product data across multiple development cycles is that the cultural shift matters more than the tooling. Analytics as a hypothesis-testing engine means every feature decision starts with a question, not an assumption. "We believe improving the onboarding modal will increase day-seven return rate by 3 percentage points. Here is how we will measure that." That kind of pre-commitment to measurement changes how teams build.
The tension between intuition and analytics is real, and I don't think intuition should be discarded. Human judgment paired with analytics outperforms either one alone. Analytics tells you the "what" and "how much." Experienced people on your team tell you the "why" and "what next." The goal is not to replace judgment with dashboards. The goal is to make sure judgment has data in the room.
Start with three metrics that map directly to decisions. Build governance before you build dashboards. Review data on a schedule that matches your shipping cadence. And never let a dashboard exist without a named human who is accountable for acting on it.
— Ben
Take your product decisions further with Formlypro
If you're building a physical product, the same principles that drive software product analytics apply directly to formulation, positioning, and market entry. Formlypro is built specifically for brands that want data at every stage of product development.

The Formlypro platform gives brands access to competitive formulation analysis, market research, compliance guidance, and an 8-phase development plan that takes a product from ideation through production. Every phase is supported by real market and competitive data, so your decisions about what to build and how to position it are grounded in what the market is actually doing, not what you think it might want. Explore Formlypro to see how analytics-driven development works end to end.
FAQ
What does product analytics actually measure?
Product analytics tracks individual user interactions inside a digital product at the event level, including feature usage, session behavior, activation milestones, and churn signals. It answers what users do inside the product, not just how they arrive.
How is product analytics different from web analytics?
Web analytics measures traffic, sessions, and page-level behavior. Product analytics measures in-product user behavior at the event level, making it the tool for understanding retention, activation, and feature adoption rather than traffic sources.
What is a good benchmark for product activation?
Products that achieve a 7% day-seven return rate rank in the top 25% for activation. This threshold is a strong predictor of sustained retention and long-term product growth.
Why do product analytics programs fail to deliver value?
Most programs fail because they track vanity metrics, lack governance, or were never tied to specific decisions. Dashboards without owners and no review cadence consistently undermine analytics value regardless of the tool being used.
How does product analytics support go-to-market strategy?
The role of analytics in go-to-market planning is to segment users by actual behavior, identify which acquisition channels produce retained users, and align messaging to the audiences most likely to activate and stay.