

Production capacity planning is the process of determining how much production capability your operation needs to meet forecasted demand without building in costly excess or leaving orders unfilled. For managers, the immediate takeaway is simple: if your forecasted weekly units exceed your demonstrated capacity, you have a gap that needs a decision, not a delay.
The foundational formula is:
Available Capacity = (Machines or Workers) × (Shifts) × (Utilization Rate) × (Efficiency Rate)
Run that calculation against your demand forecast right now. If forecasted requirements exceed the result, you are already behind. Capacity planning, as NetSuite defines it, involves three core steps: determine required capacity, assess current capacity, and plan expansions or adjustments accordingly. Everything else in this guide builds on that sequence.
Table of Contents
- What Is Production Capacity Planning, and Why Does It Matter?
- How to Plan Production Capacity: The 8-Step Process
- Strategic, Tactical, and Operational: Which Level Are You Planning At?
- Lead, Lag, and Match: Choosing the Right Capacity Strategy
- Core Metrics, Formulas, and a Worked Example
- How Capacity Requirements Planning (CRP) Validates Your Master Schedule
- Which Systems Support Production Capacity Planning?
- Key Takeaways
- Why Most Capacity Plans Fail Before They Reach the Floor
- Authoritative Sources and Further Reading
What Is Production Capacity Planning, and Why Does It Matter?
Production capacity planning sits at the intersection of demand forecasting and shop-floor execution. It answers one question: do you have enough of the right resources, at the right time, to deliver what customers expect?
The stakes are real. Underplan, and you miss orders, burn out workers, and pay premium rates for expedited materials. Overplan, and you carry idle equipment, bloated labor costs, and depreciation that eats into margin. Neither failure is abstract. Both show up in your P&L within a quarter.
IBM's capacity planning guidance makes the connection explicit: without accurate demand inputs, companies risk underutilized resources or production bottlenecks. Demand forecasting is not a separate function from capacity planning. It is the foundational input. Get the forecast wrong and every downstream calculation inherits that error.
Production capacity management also forces cross-functional alignment. Sales wants to promise delivery dates. Finance wants to minimize capital tied up in equipment. Operations needs enough runway to schedule labor and materials. Capacity planning is the mechanism that forces those three conversations to happen at the same time, with the same numbers.
How to Plan Production Capacity: The 8-Step Process
A usable capacity plan follows a defined sequence. Skipping steps, especially data gathering and bottleneck identification, is how plans end up disconnected from what actually happens on the floor.
-
Define the planning horizon and units of measure. Decide whether you are planning in weeks, months, or quarters, and pick a consistent unit (units produced, machine-hours, labor-hours). A consumer goods plant might plan in weekly units per SKU family; a job shop might plan in labor-hours per work center.
-
Gather inputs. You need four things: a demand forecast (from sales or S&OP), bills of materials and routings (from your ERP), OEE data by work center, and shift schedules including planned downtime. Missing any one of these forces you to estimate, and estimates compound.
-
Calculate required capacity. Multiply forecasted units by the standard hours per unit from your routings. Add scrap and rework allowances. This gives you the gross hours your plan demands.
-
Assess available and demonstrated capacity. This is where most plans go wrong. Available capacity is not the nameplate speed on the machine. It is what that machine actually produces over a representative period, accounting for changeovers, minor stoppages, and planned maintenance. Siemens' manufacturing capacity planning guidance is direct on this point: use demonstrated capacity, not theoretical rates. Practical capacity typically runs 70–85% of theoretical in most operations.
-
Identify bottlenecks and gaps. Compare required hours to demonstrated hours by work center. The work center where required hours most consistently exceed available hours is your constraint. Every improvement dollar spent there produces throughput gains; the same dollar spent elsewhere produces almost none.
-
Select a strategy and options. Options include adding shifts, cross-training workers, outsourcing to contract manufacturers, leasing equipment, or investing in capital expansion. Each carries a different cost profile and lead time.
-
Create an action plan. Assign owners, set timelines, and tie each action to a specific capacity gap. A plan without owners is a wish list.
-
Monitor and adjust. Compare actual output to plan weekly. When actuals diverge, trace the cause before adjusting the plan. Unexplained variances are the early warning system.
Pro Tip: Never pull demonstrated capacity from the machine's spec sheet. Pull it from your MES or production logs for the last 90 days, filtered to normal operating conditions. That number is what your schedule can actually rely on.
Essential data inputs checklist:
- Demand forecast by SKU or product family (weekly or monthly buckets)
- Routings with setup and run times per operation
- OEE by work center (availability, performance, quality)
- Shift schedules and planned downtime calendar
- Changeover time matrix by product transition
- Scrap and rework rates by operation
Strategic, Tactical, and Operational: Which Level Are You Planning At?
Production capacity planning does not happen at one level. Decisions about a new facility and decisions about tomorrow's shift schedule both involve capacity, but they require different data, different owners, and different cadences.
| Planning Level | Time Horizon | Typical Decisions | Who Owns It | Review Cadence |
|---|---|---|---|---|
| Strategic | 1–5 years | Facility expansion, new production lines, major capital investment | Executive team, VP Operations | Annual or triggered by major demand shift |
| Tactical | 1–12 months | Shift pattern changes, workforce hiring, outsourcing contracts | Production Manager, S&OP team | Monthly, tied to S&OP cycle |
| Operational | Days to weeks | Daily CRP adjustments, work center scheduling, overtime authorization | Production Planner, Shop Scheduler | Daily or weekly |
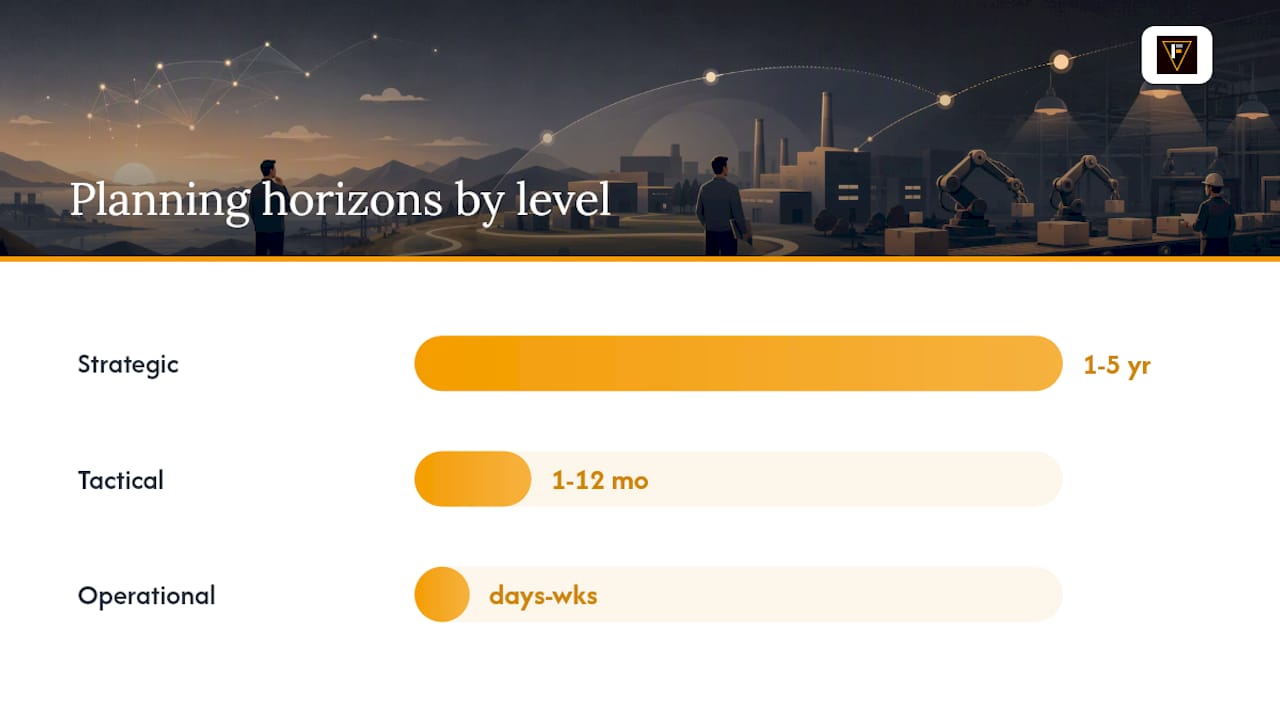
Strategic capacity decisions carry the highest cost and the longest lead time. A new production line might take 18 months from approval to first output. That means strategic planning must start from demand signals that are 2–3 years out, which requires scenario planning (best, expected, and worst case) rather than a single point forecast.
Tactical planning bridges the gap. If strategic planning approved a second shift, tactical planning figures out when to hire, train, and activate it. Tactical owners are typically the production manager and the S&OP team, working from a rolling 12-month demand plan.
Operational planning is where the rubber meets the road. The production planner runs Capacity Requirements Planning (CRP) against the Master Production Schedule (MPS) to confirm that this week's schedule is actually executable. If it is not, adjustments happen at this level before the schedule hits the floor.
Lead, Lag, and Match: Choosing the Right Capacity Strategy
Three strategies cover most capacity expansion decisions. The right one depends on your margin profile, forecast confidence, and how much service-level risk you can absorb.
| Strategy | Definition | Cost Risk | Service-Level Risk | Best Fit |
|---|---|---|---|---|
| Lead | Build capacity ahead of demand | High (idle capacity if demand misses) | Low (buffer absorbs surges) | High-growth, high-margin, long equipment lead times |
| Lag | Add capacity only after demand is confirmed | Low (no idle capacity) | High (missed orders during ramp-up) | Niche, bespoke, or low-growth products |
| Match | Incrementally add capacity in step with demand | Moderate | Moderate | Stable, predictable demand with short lead times |
Industry guidance on capacity planning strategy identifies these three postures as the standard framework, with the choice driven by cost exposure versus responsiveness trade-offs.
When to use each:
- Lead strategy fits a fast-growing CPG brand launching a new supplement SKU into retail. If a major retailer commits to shelf space, you cannot afford a stockout in month two. The cost of idle capacity for a few weeks is far cheaper than a lost distribution agreement.
- Lag strategy fits a contract manufacturer producing a bespoke, low-volume specialty product. Demand is predictable and small. Building ahead means carrying cost with no return.
- Match strategy fits a mid-size food manufacturer with stable seasonal patterns. You add a part-time shift in Q3, drop it in Q1, and keep utilization in a healthy range year-round.
Decision signals to watch:
- Utilization consistently above 85%: consider lead or match to avoid a service-level crisis
- Forecast confidence below 70%: lag strategy reduces the risk of stranded capital
- Equipment lead times above 6 months: lead strategy is almost mandatory for growth scenarios
- Margin sensitivity is high: lag or match to protect cash flow
Core Metrics, Formulas, and a Worked Example
Understanding the formulas is one thing. Seeing them applied to a real production scenario is what makes them stick.
Definitions and formulas
Design Capacity: The maximum output a facility can theoretically achieve under ideal conditions. Useful for benchmarking, not for scheduling.
Effective Capacity: Design capacity minus planned downtime, scheduled maintenance, and changeovers. This is the ceiling for what a realistic plan can target.
Actual Capacity (Demonstrated Capacity): What the operation actually produces, measured over a historical period. Always lower than effective capacity due to minor stoppages, quality losses, and unplanned events.
Utilization: Actual output ÷ Design capacity × 100
Efficiency: Actual output ÷ Effective capacity × 100
OEE (Overall Equipment Effectiveness): Availability × Performance × Quality. A composite measure of how much of the planned production time is truly productive. NetSuite's manufacturing capacity analysis guide describes OEE as the primary diagnostic tool for pinpointing whether capacity losses come from downtime, speed losses, or quality defects.
Worked example: converting a forecast into a capacity gap
Scenario: A nutraceutical manufacturer forecasts 10,000 units per week of a new capsule product. Each unit requires 0.05 labor-hours (3 minutes) at the encapsulation work center. The work center runs two 8-hour shifts, 5 days a week, with two encapsulation lines.
-
Required hours: 10,000 units × 0.05 hours = 500 labor-hours required
-
Theoretical available hours: 2 lines × 2 shifts × 8 hours × 5 days = 160 machine-hours per week
-
Demonstrated capacity adjustment: Historical OEE for this work center is 78%. Demonstrated hours = 160 × 0.78 = 124.8 hours available
-
Capacity gap: 500 hours required vs. 124.8 hours available. That is a gap of 375.2 hours, which signals the plan is not executable as written. The team needs to either add lines, add shifts, outsource, or revise the forecast phasing.
This is exactly the kind of calculation that prevents a sales team from committing to a launch date the floor cannot meet.
Common calculation pitfalls:
- Using nameplate (theoretical) speed instead of demonstrated rates
- Ignoring changeover time between product runs
- Failing to account for product mix (a line that runs 100% of one SKU performs differently than one switching between 10 SKUs)
- Omitting scrap and rework hours from the required-capacity calculation
How Capacity Requirements Planning (CRP) Validates Your Master Schedule
Capacity Requirements Planning is the formal process of checking whether your Master Production Schedule (MPS) is actually executable given real work center constraints. The flow is: MPS → CRP → shop-floor schedule.
Rockwell Automation's capacity planning guide explains that CRP validates master production schedules by calculating detailed capacity needs using routings, work centers, and lead times. Without CRP, you are releasing a schedule to the floor and hoping it works.
Running CRP in practice:
- Pull open production orders and planned orders from the MPS
- Apply routings (setup time + run time per operation) to each order
- Aggregate required hours by work center and time bucket (usually weekly)
- Compare aggregated requirements to demonstrated capacity per work center
- Flag any work center where requirements exceed capacity in a given bucket
- Resolve overloads by shifting orders, splitting lots, adding overtime, or outsourcing
Finite vs. infinite scheduling:
Infinite scheduling assumes unlimited capacity and simply calculates when work would be done if nothing got in the way. It is fast and useful for rough-cut planning, but it produces schedules the floor cannot execute. Taktora.AI's manufacturing capacity planning guide explains that finite schedulers close the gap between plan and execution by producing time-sequenced, constraint-respecting schedules and automatically re-optimizing after disruptions.
Finite scheduling is more computationally intensive and requires accurate routing and capacity data, but it is the only approach that produces a schedule the shop floor can actually follow. Use infinite scheduling for strategic and tactical horizon planning; switch to finite for operational scheduling within a 4–8 week window.
Why bottleneck focus matters: Adding capacity at a non-bottleneck work center produces almost no throughput gain. The system's output is governed by its constraint. Identify the bottleneck through CRP analysis, then concentrate improvement efforts there before touching anything else.
Which Systems Support Production Capacity Planning?
No single system handles every layer of capacity planning. Most U.S. manufacturers use a combination, and the integration between them is where data quality problems tend to hide.
ERP (Enterprise Resource Planning): SAP, Oracle, Microsoft Dynamics, and similar platforms hold the master data: routings, BOMs, work center definitions, and demand signals from customer orders. ERP is the source of truth for planning inputs, but most ERP scheduling engines use infinite capacity logic.
APS (Advanced Planning and Scheduling): Tools in this category apply finite capacity logic to produce executable schedules. They consume ERP master data and output sequenced work orders that respect real constraints. This is the layer that bridges the gap between a plan and a schedule.
MES (Manufacturing Execution Systems): Platforms like Rockwell's FactoryTalk or Siemens' Opcenter capture real-time production data: actual start/stop times, quantities produced, downtime events. MES data feeds demonstrated capacity calculations and closes the loop between planned and actual.
OEE Platforms: Standalone or integrated OEE tools aggregate machine-level data to calculate availability, performance, and quality rates. Small improvements in OEE often deliver better ROI than immediate capital expansion, because they recover capacity that already exists.
Quick selection checklist:
- Small manufacturer (under 50 employees): Start with ERP + a spreadsheet-based CRP model. Add APS when scheduling complexity outgrows manual tools.
- Mid-size manufacturer: ERP + APS is the standard stack. MES integration becomes valuable when demonstrated capacity data is unreliable.
- Large or complex manufacturer: Full ERP + APS + MES + OEE integration. Data governance and routing accuracy become the primary constraints on planning quality.
Data hygiene priorities: Accurate routings and validated standard times are the single biggest lever on plan quality. An APS running on bad routing data produces a precise wrong answer. Before investing in scheduling software, audit your routing accuracy. Then validate OEE inputs. Then worry about the tool.
Key Takeaways
Production capacity planning works when you ground it in demonstrated capacity, match your strategy to your demand confidence, and validate every master schedule through CRP before it reaches the floor.
| Point | Details |
|---|---|
| Use demonstrated capacity | Plan from historical run rates (typically 70–85% of theoretical), never nameplate speeds. |
| Match strategy to risk profile | Lead strategy fits high-growth, high-margin products; lag fits niche or low-growth; match fits stable demand. |
| CRP validates the MPS | Run Capacity Requirements Planning against routings and work center data before releasing any schedule. |
| Bottleneck focus multiplies ROI | Capacity improvements at the constraint drive throughput; investments elsewhere produce minimal gain. |
| Stage your rollout | Pilot CRP at the bottleneck first (months 2–4), then expand; capital projects run 60%+ over schedule on average. |
Why Most Capacity Plans Fail Before They Reach the Floor
The gap between a capacity plan and a working schedule is almost always a data problem, not a methodology problem. Planners understand lead, lag, and match. They know what CRP is. What breaks the plan is a routing last updated three years ago, an OEE figure pulled from a vendor's brochure, or a demand forecast that sales and operations never actually agreed on.
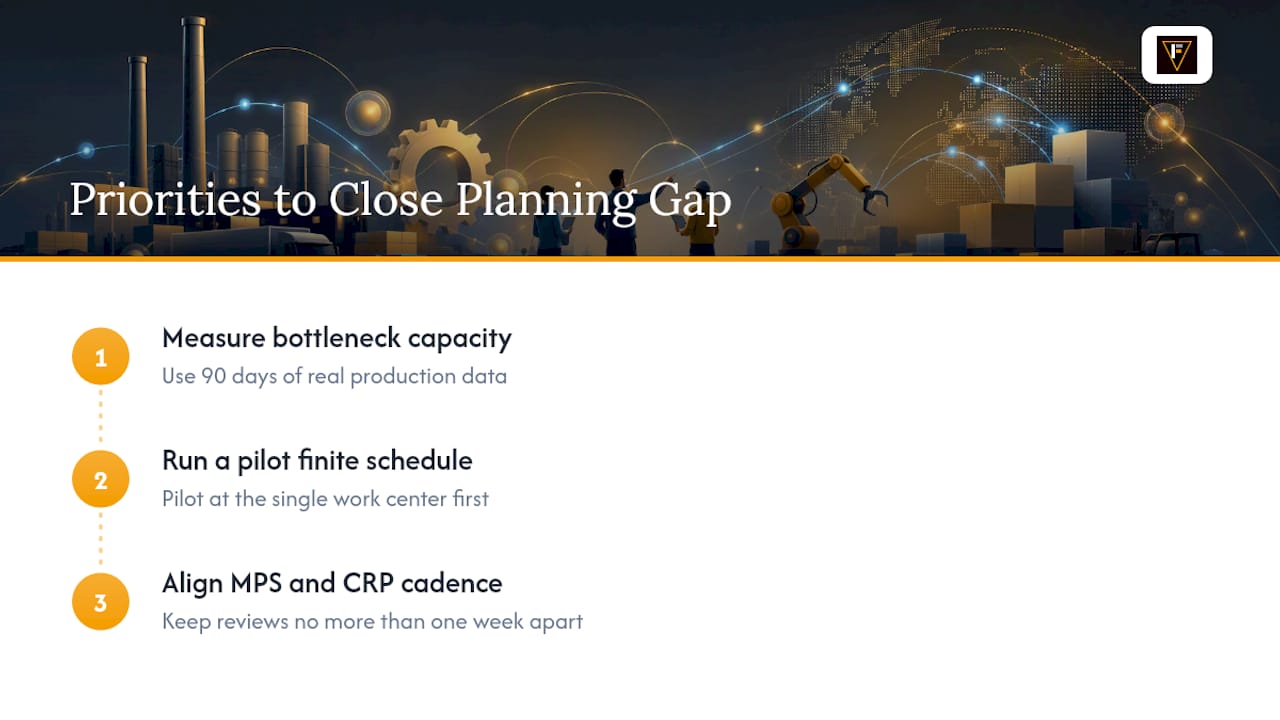
The three priorities I would act on first, in order: measure demonstrated capacity at your bottleneck using 90 days of real production data; run a pilot finite schedule at that single work center before touching anything else; then align your MPS review cadence with CRP so the two are never more than a week apart.
The payoff is measurable. Operations teams that close the loop between planning and execution typically see throughput gains, lower expedited shipping costs, and improved on-time delivery within two to three months of a disciplined pilot. None of that requires a seven-figure software investment. It requires accurate data and the discipline to use it.
Authoritative Sources and Further Reading
The following resources provide deeper coverage of production capacity planning, CRP, and finite scheduling for U.S. manufacturing operations.
- Capacity Planning Defined | NetSuite
- Capacity Planning Strategy: Aligning Manufacturing Resources with Demand
- Capacity Planning: An Industry Guide | Rockwell Automation | Plex | US
- Manufacturing capacity planning (Siemens)
- Manufacturing capacity analysis | NetSuite
- Capacity planning | IBM
- Manufacturing Capacity Planning: A Guide to RCCP, CRP, and Execution | Taktora.AI
Recommended worksheet: Build a "Forecast → Work-Hours → Capacity Gap" spreadsheet with five columns: SKU, forecasted weekly units, standard hours per unit (from routing), required hours (units × standard hours), and available demonstrated hours by work center. The gap column (required minus available) is your weekly decision trigger. Any positive number needs a resolution before the schedule is released.
For supplement and nutraceutical brands managing the full arc from formulation through production, Formlypro provides an 8-phase product development workflow that includes production planning, compliance, and manufacturer-ready exports, giving operations teams a structured path from concept to launch.